 Now we apply several
operations of data processing and interpretation in AnisPack software.
First operation is spectra calculation. The spectral approach helps to
fulfill deep and full ARS data analysis. The ARS diagram is a periodic
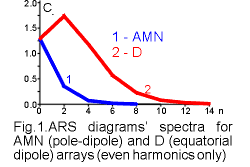
function, and has a discrete spectrum. Fig.1 shows the results of spectra
calculations for theoretical ARS diagrams of pole - dipole (1) and dipole
equatorial (2) arrays above anisotropic half-space with longitudinal and
transversal resistivities equal to 1 and 3. Lines show bending around discrete
spectra of
  only
even harmonics (odd ones are equal to zero). The spectrum for AMN array
(1) has maximum at zero harmonic (which reflect mean resistivity of the
medium), while the second and the next even harmonics are much smaller.
The spectrum for "D" array (2) has maximum at the second harmonic, which
is higher then zero one. The second harmonic is the most important for
sensitivity to anisotropy. That is why D array is much more sensitive to
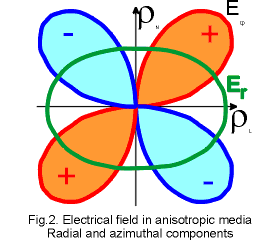
anisotropy in comparison with any linear array. All linear arrays measure
only radial component of electric field intensity (except pole-pole one,
which measures potential), while non-linear arrays measure both radial
and azimuthal components. Azimuthal component is much more sensitive to
anisotropy (fig.2) and give this high sensitivity to non-linear arrays.
only
even harmonics (odd ones are equal to zero). The spectrum for AMN array
(1) has maximum at zero harmonic (which reflect mean resistivity of the
medium), while the second and the next even harmonics are much smaller.
The spectrum for "D" array (2) has maximum at the second harmonic, which
is higher then zero one. The second harmonic is the most important for
sensitivity to anisotropy. That is why D array is much more sensitive to
anisotropy in comparison with any linear array. All linear arrays measure
only radial component of electric field intensity (except pole-pole one,
which measures potential), while non-linear arrays measure both radial
and azimuthal components. Azimuthal component is much more sensitive to
anisotropy (fig.2) and give this high sensitivity to non-linear arrays.
V.A. Shevnin, I.N. Modin
Tel. & fax: (7-095) 939 49 63
E-mail: sh@geophys.geol.msu.ru